


DISC is one of the most researched and studied behavioral assessments available. It’s also the oldest personality assessment.
William Moulton Marston outlined a theory of behavior in 1928. Marston theorized that he could categorize people based on learned behavioral traits. In his book, Emotions of Normal People, he first identified four behavioral styles (Dominance, Submissiveness, Inducement, and Compliance).
However, Marston didn’t create an assessment from his theory, and his work is now in the public domain. For that reason, you will find many DISC Profiles and assessments with varying levels of research.
In this article, we will outline how DISC assessments are researched. We will cover:
Our goal overall is that you understand a little more about the work behind creating an experience where you learn more about yourself and others when you take this assessment.
Assessment research can cover lots of different areas. Often, the use of the assessment will determine what research is needed for it to go to market.
Most DISC research focuses on two areas of research: Reliability and Validity.
While no DISC Assessment will ever be perfectly reliable or perfectly valid, it’s important the weaknesses of the tool are understood. When looking at assessment research, the best question is, “How much evidence is there for the reliability of this tool?” rather than, “Is this tool reliable?”
Is the tool consistent? Are the measurements dependable?
Does the tool measure what it's supposed to measure?
DISC seeks to measure a person’s response to a series of statements about themselves. Their responses are used to calculate a score based on the below four scales:
When conducting research for reliability and validity, the researchers were looking to understand if the assessment correctly identified a person’s DISC style and if it was identified correctly consistently.
When testing for reliability for DISC or any four-quadrant models, it’s important to recognize that these instruments are self-reported. That is, the person taking the assessment identifies their own traits (qualities).
This is important to keep in mind because a person’s final assessment score will never be absolute. As our perception of ourselves changes, so will the final score of the assessment. That said, DISC instruments or any other similar type of personality instrument doesn’t measure quantities (like blood pressure or cholesterol). Instead, it measures qualities that individuals report about themselves.
You probably know this, but people are notoriously inconsistent in their perceptions. We change our view when we are hungry, sad, or because we didn’t get enough sleep.
So, how do researchers determine the right level of inconsistency when trying to determine if an assessment is consistent?
Statistics.
Specifically a specific type of statistical analysis called Cronbach’s Alpha or Coefficient Alpha.
This statistical tool works by finding how a large number of people’s scores correlate between each of the scales. It is measured by correlating the score for each scale item with the total score for each test taker.
The Cronbach’s Alpha / Coefficient Alpha represents the number of items in a test, the average covariance between pairs of items, and the variance of the total score.
All of this is represented as a number between 0 and 1. The closer Cronbach’s Alpha is to 1 the higher the covariances are on the assessment. Most researchers recommend a minimum score between 0.70 and 1. Here are the following guidelines:
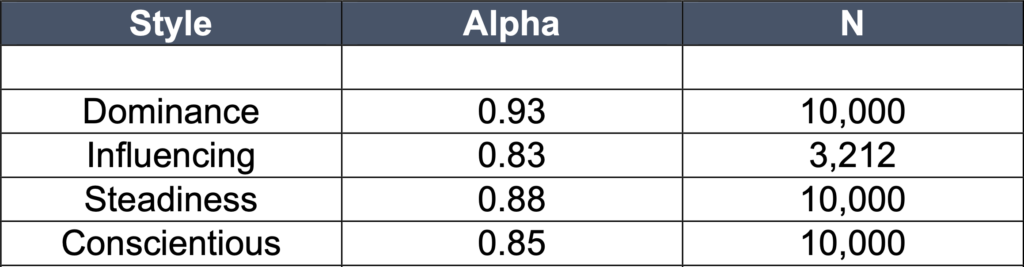
So how does DISC Basic measure? Below are the scores for the four primary styles (Dominance, Influencing, Steadiness, Conscientious). You will see that each style except for Influencing was tested with 10,000 unique assessments. Influencing was tested against 3,212 unique assessments:
DISC Basic’s reliability falls within the Very Good to Excellent range because its alpha was found to be between .83 and .93 for each style.
How do we know what an assessment is really measuring? Researchers use a measurement that is able to find a pattern of correlations. The measurement is called construct validity.
Construct validity essentially seeks to understand if a test or an assessment measures what it’s supposed to measure. It answers the question: “Does the measure behave like the theory says a measure of that construct should behave”?
In regards to DISC, you would hope to see near-perfect alignment (strong correlation) when you are comparing two test results for the same style. Likewise, you would hope to see different styles have a weak correlation with each other. Afterall, if a person takes a DISC assessment and they go from having a strongly correlated D-Style to a strongly correlated S-Style, the assessment isn’t valid.
The validity correlations are measured between the numbers 0 and 1. When two correlated styles score closer to 0, they are considered to be weakly correlated. The opposite is true when the correlation score is closer to the number 1.
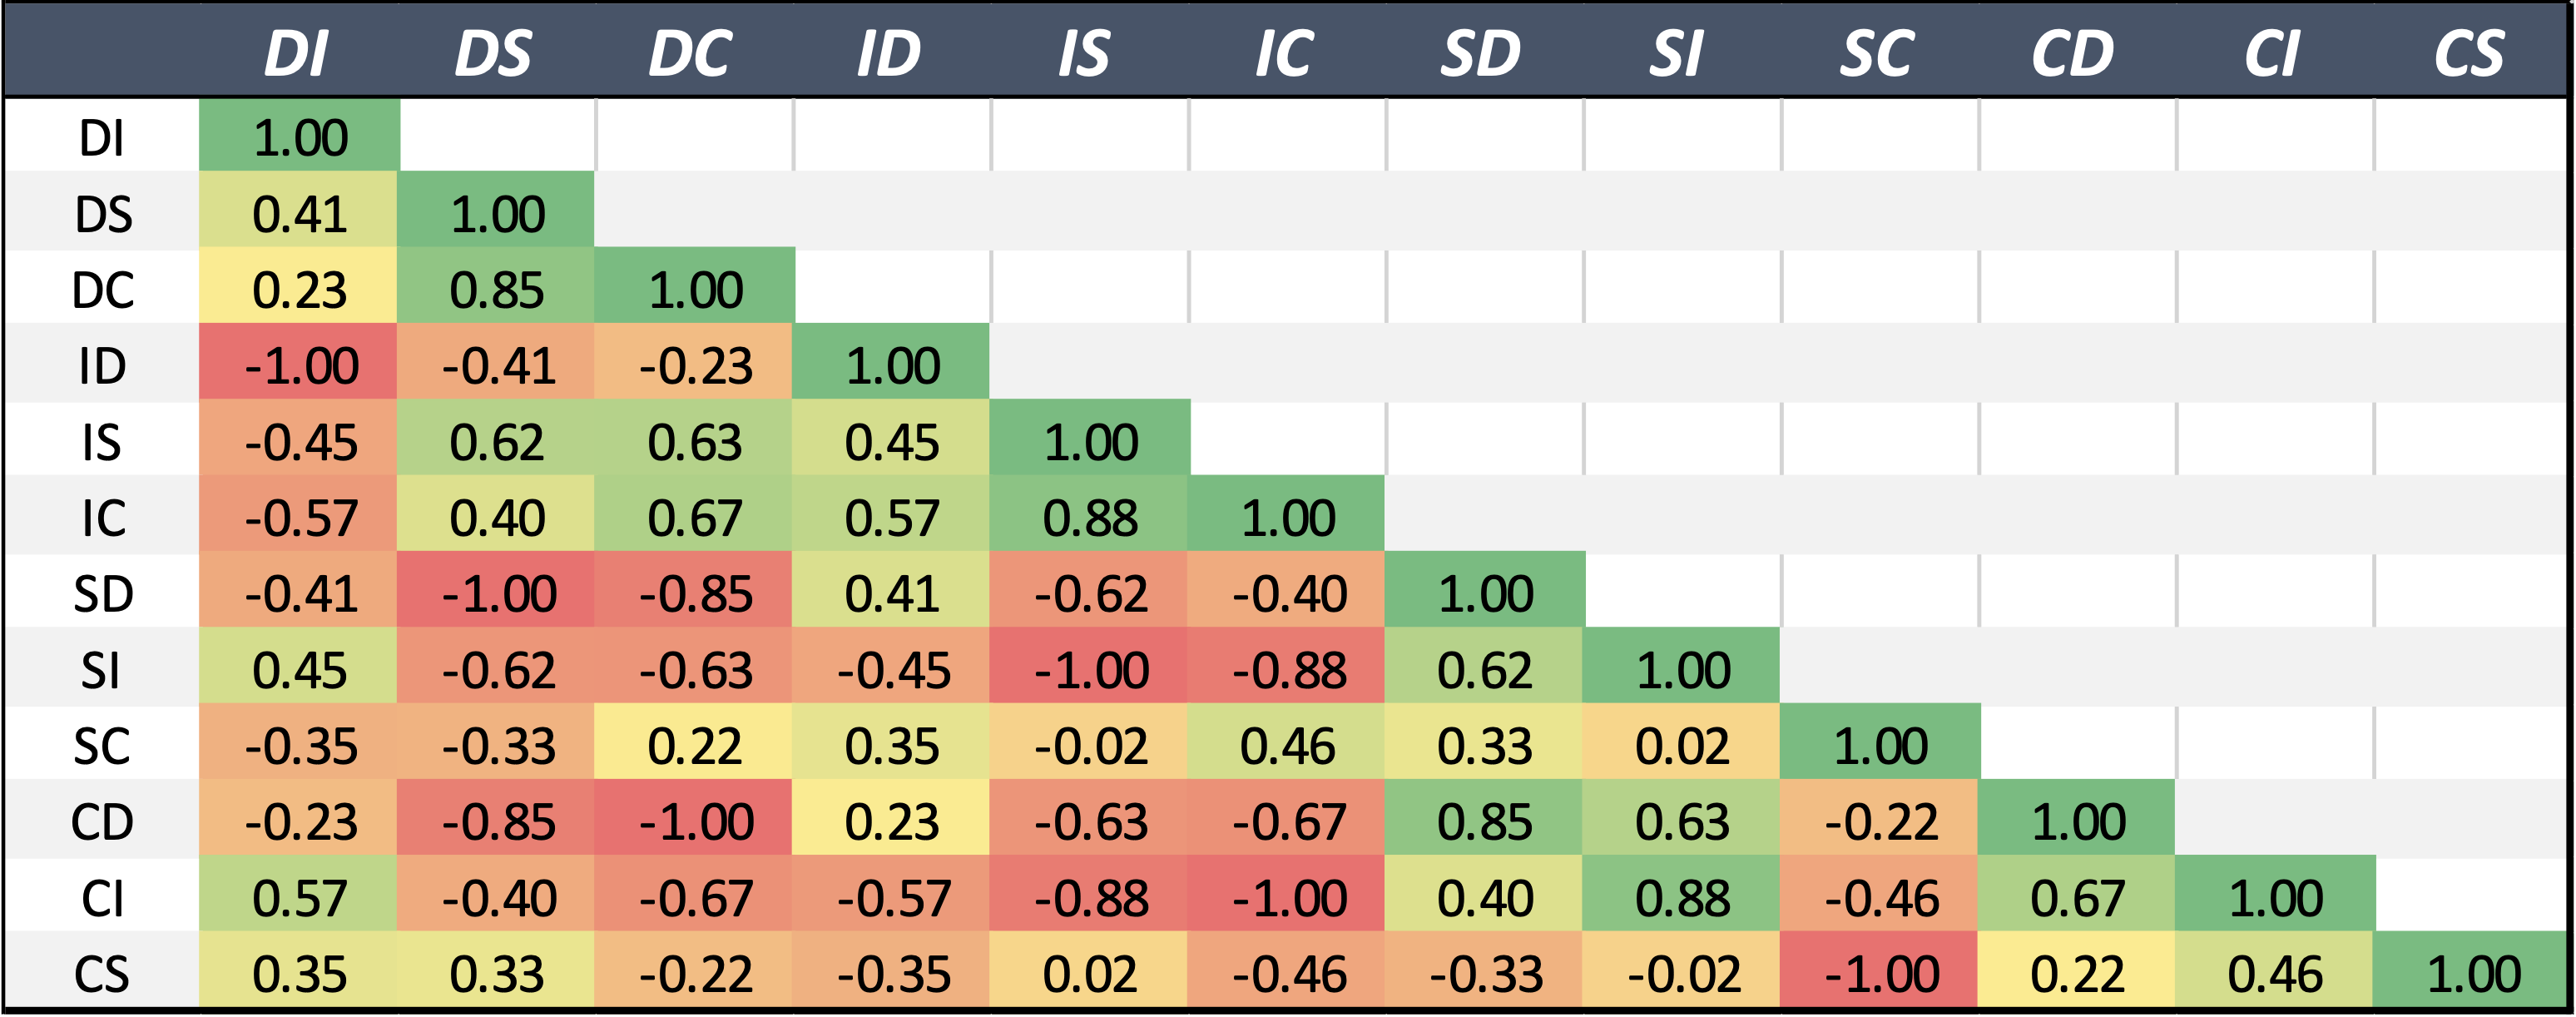
Here is what DISC Basic’s validity correlations showed:
The research shows that there is alignment when it’s needed and weaker ties when comparing the various style to each other. Overall, DISC Basic is a valid tool and has proven that it measures what it intends to measure.
The Equal Employment Opportunity Commission (EEOC) is a federal agency responsible for setting guidelines for assessment use in the workplace. Often, their regulations are used in hiring and selection, but their rules are also used to ensure assessments don’t show any demographic, racial, or disability bias.
DISC was researched for disparity impacts in the following areas using the EEOC guidelines:
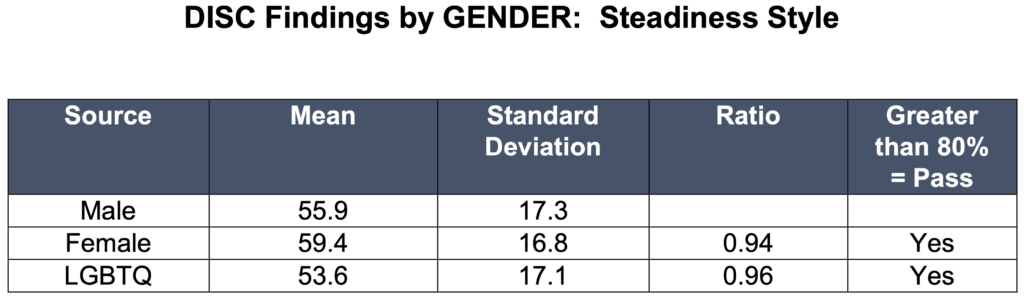
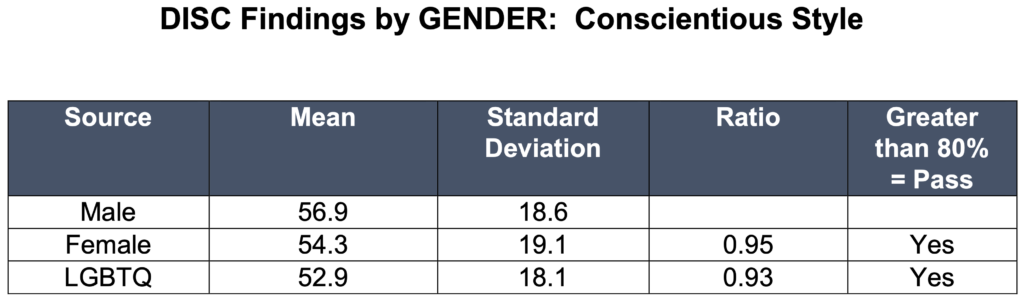
The disparate impact study analyzed the effects on these groups using the 80% Rule or the 4/5ths Rule. Typically, the 80% rules look to understand if the protected classes are hired by less than 80% of the group with the highest rate. In this study, the 80% rule was applied to the assessment data.
The study compares the mean scores by each protected class and is reviewed to see if its mean ratio values are greater than or less than the 80% guideline. If the comparative scores are less than 80% the study would assume that the assessment disparitely impacts the group that is being review. If the scores are above 80%, the study would conclude that no disparative impact was found.
Below is the list of protected groups compared to the control group (non-protected group):
The study reviews each group for each style (Dominance, Influencing, Steadiness, and Conscientious).
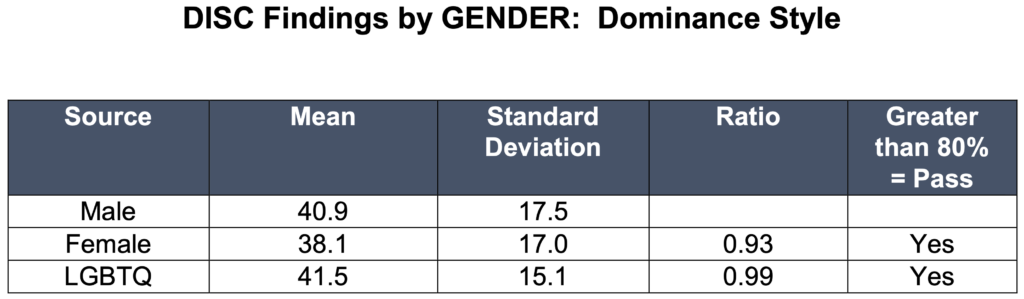
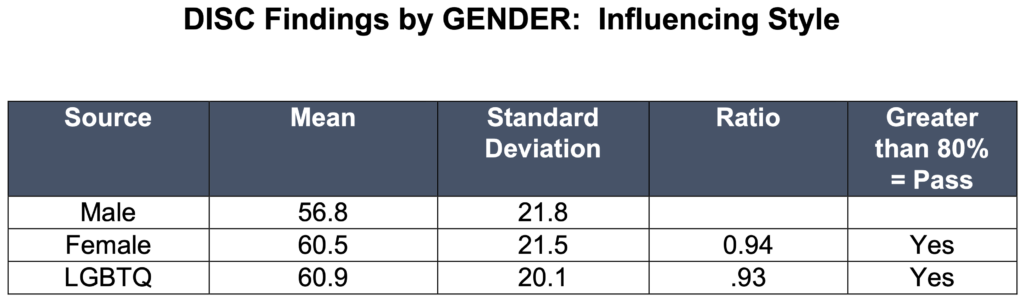
Female & LGBTQ assessment data compared to Male assessment data. Each style was found to have no disparate impact on Gender (ratio scores were higher than 80%).
African American, Asian, Hawaiian or Pacific Islander, Latino or Hispanic, Middle Eastern, and Native American group’s individual assessment data compared against Caucasians assessment data. Each style was found to have no disparate impact on ethnicity. Ratio scores for each style was above 80%.
African American, Asian, Hawaiian or Pacific Islander, Latino or Hispanic, Middle Eastern, and Native American groups individual assessment data compared against Caucasians assessment data
Disabled, Disabled Veteran, other veterans, Vietnam veteran individual assessment data compared against non-veteran or non-disabled assessment data